• Over the past two weeks, my understanding of teaching data and probability has deepened in an important way. I used to think of this content area as fairly straightforward: collect data, make a graph, answer questions. Now I’m realizing that while students can often complete those steps, they don’t always understand what the data actually means or, perhaps more importantly, why it matters.

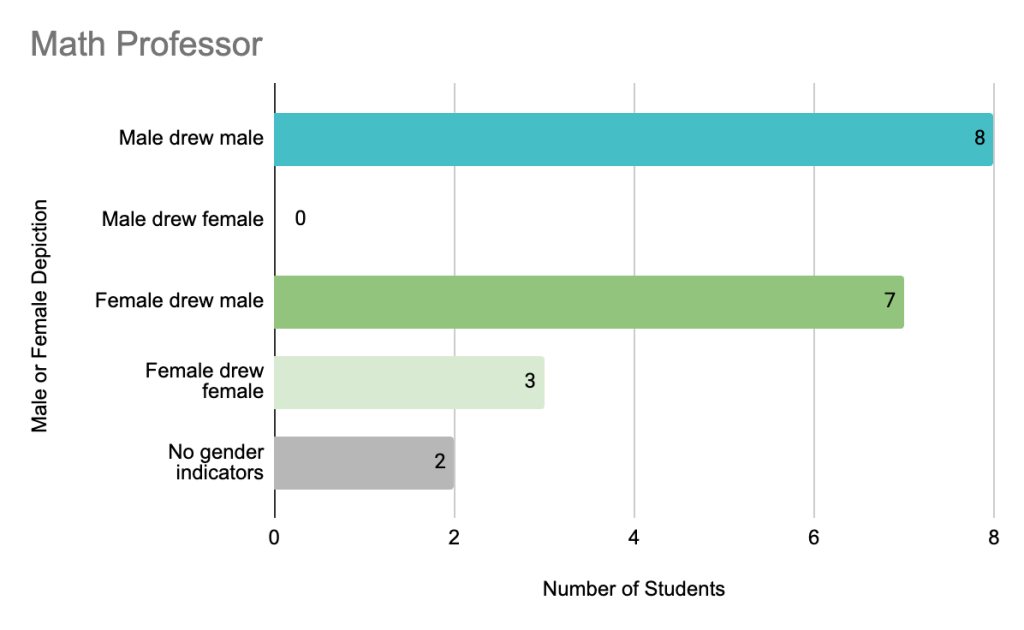
    I keep returning to something that feels obvious now but wasn’t before: data is not neutral. The examples we choose, the questions we ask, and even the way data is presented all shape how students interpret the world. Gutstein and Peterson (2013) emphasize that mathematics should help students understand their lives and surroundings, not just practice isolated skills. That made me reconsider how often I’ve relied on pre-made data sets or word problems that don’t connect to anything real for my students.

    At the same time, I’ve been thinking a lot about access. In my classroom, I have students who can interpret patterns when data is visual or hands-on, but struggle when that same idea is embedded in a word problem. I wonder how often I’ve mistaken reading difficulty for a lack of mathematical understanding. What if some of my assessments are measuring literacy more than math? That question has pushed me to think more critically about how I design tasks and what I’m actually asking students to do.

    Video 1: A look at how real-world data collection can help students connect math to their own environment and experiences

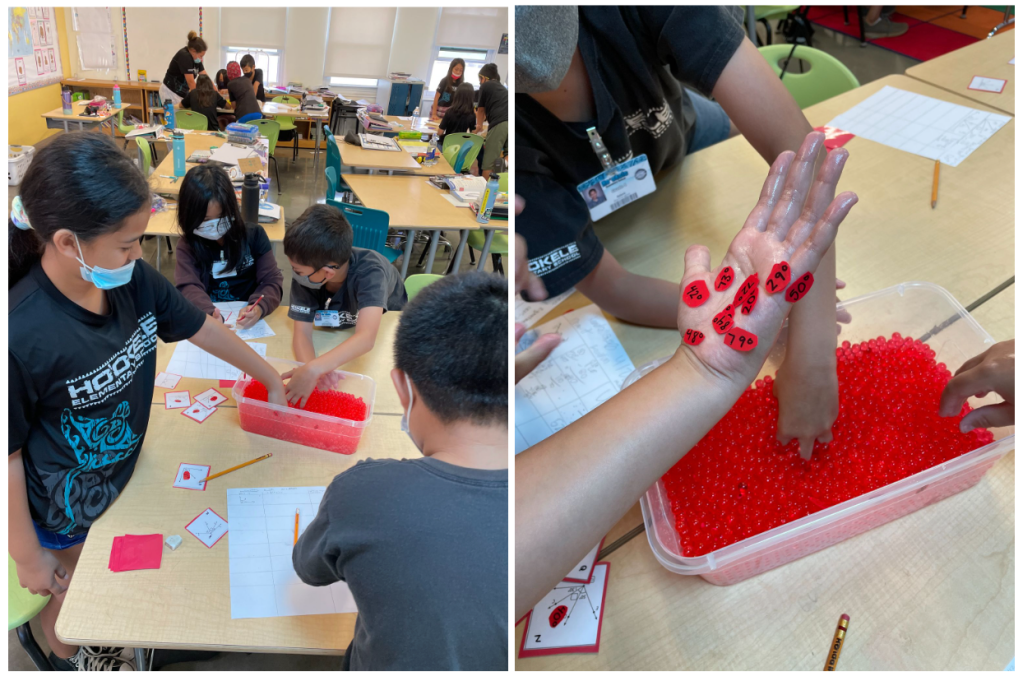
    Because of this, I’ve started to rethink what it means to teach data well. Instead of starting with a graph, I want to start with experiences. Taking students outside to collect their own data or having them build class graphs with tools like bingo dotters shifts both accessibility and engagement. One moment that stuck with me was when a student chose to collect trash instead of natural items and noticed that hot chip bags were the most common litter on our playground. That wasn’t just a graph, it became a conversation about patterns, habits, and their environment.

    This is where data and probability move beyond a skill and become a way of interpreting the world.

    This also connects to Teaching Mathematics for Social Justice (TMFSJ). I used to think this meant designing lessons around large, complex issues, but now I see it beginning with students’ own experiences. When students use data to understand their playground, classroom, or community, they begin to develop what Ladson-Billings (1995) describes as critical consciousness. They are not just doing math, they are using it to investigate, inquire, and improve their environment.

    Moving forward, I’m still wondering how far to push these ideas. 

    • What is the balance between skill development and deeper meaning? 
    • What if I focused less on perfect graphs and more on student thinking and interpretation? 

    I don’t have a complete answer yet, but I do know my approach to teaching data and probability will shift. It will be less about fulfilling a checklist and more about helping students make sense of the world around them.

    References

    Gutstein, E., & Peterson, B. (2013). Rethinking mathematics: Teaching social justice by the numbers. Rethinking Schools.


    Ladson-Billings, G. (1995). Toward a theory of culturally relevant pedagogy. American Educational Research Journal, 22(3), 465–491.

  • Over the past two weeks, my thinking about algebra has started to shift in an unexpected way. I came in ready to focus on content and tools. I am leaving thinking about identity.

    Algebra, even at the 3rd grade level, asks students to make sense of relationships, patterns, and unknowns. This work builds their mathematical foundation. For my students, this shows up in how they make sense of equal groups, unknown quantities, and the relationships between operations. However, I am beginning to wonder if access to that kind of thinking is truly equal in our classrooms.

    In a recent activity, I asked my students to draw what they think a mathematician looks like. The results were not surprising, but they were unsettling. Many of the drawings reflected narrow ideas of who belongs in math.

    Figure 1: Student representations of mathematicians.

    This directly connects to research by Kim et al. (2025), who found that students’ perceptions of mathematicians are influenced by gender. Seeing these patterns in my own classroom made the research feel immediate and real.

    I find myself asking: What messages are my students already carrying about who is “good” at math? And, perhaps more importantly, what am I doing, intentionally or unintentionally, to reinforce or disrupt those ideas?

    This is where my Knowledge of Content and Students (KCS; Hill & Ball, 2009) has deepened. Algebra is not just about solving for an unknown. It is about who feels comfortable engaging with the unknown in the first place. If a student already believes math is “not for them,” then even the most engaging lesson or technology will have limited impact.

    The readings on identity ignited this thinking and pushed me further. Crenshaw (2016) discusses how overlapping identities shape experiences, and Cosby (2020) highlights how controlling images can influence how Black girls experience mathematics spaces. This aligns with broader understandings of identity as shaped by social experiences and context (Psychology Today, n.d.). 

    I cannot ignore the fact that identity is a part of math learning. I have come to realize it is embedded within it.

    Now I begin to question my use of technology as well. What role does technology play in shaping participation and identity in algebra learning?

    Tools like Flocabulary or Polypad can make ideas more accessible and engaging.

    Video 1: Example of Flocabulary supporting math vocabulary.

    They can provide multiple entry points and reduce barriers to participation. However, it is important to acknowledge that they also come with constraints. Technology cannot replace meaningful discourse, and it cannot fully account for the social dynamics that shape who speaks, who hesitates, and who feels seen in our classroom. If anything, technology can sometimes hide who is participating and who is not if we are not paying close attention.

    Ultimately, the goal is not to find the “best” technology, but to use technology intentionally within a classroom culture that values all ways of participating.

    This brings me back to my own practice. If I want students, especially those who are historically marginalized, to see themselves in mathematics, I have to be deliberate. I have to create spaces where their ideas are heard, where mistakes are normalized, and where multiple ways of thinking are valued. I have to pay attention not just to who is correct, but to who is contributing, who is trying, and who is quietly disengaging.

    Algebra is often introduced as a shift in thinking. For me, it has become a shift in perspective.

    It is not just about solving for x.
    It is about who believes they are allowed to try.

    References

    Cosby, M. D. (2020). No Black girls allowed: A poststructural analysis of controlling images in Black girls’ undergraduate mathematics learning experiences (Doctoral dissertation, Michigan State University). ProQuest Dissertations & Theses Global.

    Crenshaw, K. (2016). The urgency of intersectionality [Video]. TED Conferences. https://www.ted.com/talks/kimberle_crenshaw_the_urgency_of_intersectionality

    Hill, H. C., & Ball, D. L. (2009). The curious—and crucial—case of mathematical knowledge for teaching. In F. K. Lester Jr. (Ed.), Second handbook of research on mathematics teaching and learning (pp. 111–155). Information Age Publishing.

    Kim, J., Hornburg, C. B., Grose, G. E., Levinson, T. G., & Fazio, L. K. (2025). Picturing mathematicians: Examining how gender and math anxiety relate to students’ representations of mathematicians in late elementary and middle school. Journal of Experimental Child Psychology, 258, Article 106290. https://doi.org/10.1016/j.jecp.2025.106290Psychology Today. (n.d.). Identity. https://www.psychologytoday.com/us/basics/identity

  • This evaluation grew out of curiosity sparked in another course. While reading research about how students picture mathematicians and scientists, I wondered how my own third graders might respond to similar prompts. Instead of simply wondering, I tried it.

    I designed a small classroom activity where students listened to completely gender-neutral descriptions of four professions: scientist, doctor, math professor, and nurse. After each story, students drew the professional they imagined. The drawings became a simple but powerful dataset revealing how students mentally represent different careers.

    To evaluate this intervention, I used Brinkerhoff’s Success Case Method, which focuses on examining the strongest successes and clearest failures of an intervention to understand what is actually working. Rather than averaging results, this model highlights where meaningful change occurred and where barriers remained.

    The visual evaluation below walks through the intervention, identifies success and non-success cases, and analyzes the patterns that emerged. In short, the activity disrupted some stereotypes but had little effect on other deeply rooted stereotypes.

    I also experimented with using AI tools to help organize this evaluation. By uploading my sources and data into NotebookLM, I was able to generate and refine ideas for structuring the visual analysis. Used thoughtfully, tools like this can support the creative process without replacing the thinking behind it.

    Sometimes the most interesting discoveries in education happen when curiosity turns into action. This small classroom experiment reminded me that even simple activities can reveal powerful insights about the ideas students are already carrying with them.

    Resources

    Deller, J. (2021, November 30). Brinkerhoff model 101: Methodology and goals. Kodo Survey. https://kodosurvey.com/blog/brinkerhoff-model-101-methodology-and-goals

    Kim, J., Hornburg, C. B., Grose, G. E., Levinson, T. G., & Fazio, L. K. (2025). Picturing mathematicians: Examining how gender and math anxiety relate to students’ representations of mathematicians in late elementary and middle school. Journal of Experimental Child Psychology, 258, Article 106290. https://doi.org/10.1016/j.jecp.2025.106290

  • Three weeks ago, if you had asked me how I felt about teaching geometry, I would have said I enjoy it. It’s active. It’s visual. It gives students something to move, build, and at times, argue about. It can feel refreshing after long stretches of number work.

    However, I don’t think I had fully examined how I was teaching it.

    Geometry has often lived at the edges of my planning. Not because I do not value it, and not because I choose it to be that way, but because it is almost always positioned at the end of our pacing guides. When time is constricted, something has to get squeezed. Geometry tends to be flexible enough to take that pressure.

    Over the past few weeks, I’ve been sitting with that pattern. What does it mean if spatial reasoning consistently receives less sustained attention than computation? What habits are we building in students if geometry becomes a short, energetic unit instead of an ongoing way of thinking?

    I kept coming back to my own classroom.

    I’ve done my “lost angle” search in a bin of Orbeez. I’ve watched students rebuild circles by collecting angle pieces around the room. I’ve led games where students use their arms to form rays and perpendicular lines. Those lessons were lively and memorable. Students were engaged, smiling, and fully immersed.

    And yet, I started asking myself:

    • Was engagement enough?
    • Were students reasoning deeply, or were they completing tasks wrapped in novelty?
    • Who was doing the explaining?
    • Who was hanging back?
    • What counted as participation in my room?

    That realization pushed me to think beyond individual lessons. If I want geometry to feel accessible, I cannot rely on engaging activities alone. I have to design structures that widen entry points. I have to make space for students to explain, revise, and build on each other’s thinking. I have to treat participation as something larger than who speaks the most.

    That thinking led me to create a Geometry Toolkit, a simple, teacher-friendly Google Site that brings these ideas together in one place. It includes playful lessons, conversation supports, technology integration, reflection checkpoints, and aligned assessment tools. The goal is not to overwhelm, but to offer practical ways to make geometry more intentional and more inclusive.

    Building it clarified something for me. I do not just want students to name shapes or calculate measures. I want them to experience geometry as a way of noticing patterns and structure. I want them to feel comfortable revising their thinking. I want them to see themselves as capable of reasoning, even when they are not yet certain.

    The activities I love are still there. The movement is still there. The energy is still there. What has changed is the purpose behind them.

    I used to think geometry was a nice change of pace. Now I see it as an opportunity to reshape how my students experience mathematics altogether.

    And that feels worth protecting time for.

    If you are curious, click to explore the Geometry Toolkit!

  • This project is the culmination of my work this semester and, honestly, it began with frustration.

    As Berger (2014) reminds us, better questions lead to better thinking. Instead of continuing to complain about a perceived problem in education, I decided to ask a more precise question.

    To explore that question, I surveyed teachers and examined both quantitative and qualitative data. The results were clear, and what I found was tension. 

    This project does not offer a neat solution. Wicked problems rarely do. Instead, it examines the space between belief and system design. To keep asking better questions about the structures we’ve accepted as normal…and whether they actually serve the way children learn.

    Below you’ll find two versions of my presentation: one for independent exploration and one with narration. My hope is not to “solve” this issue in one semester, but to continue asking better and more beautiful questions (Berger, 2014).

    Figure 1. A link to an independent exploration Prezi
    Figure 2. A link to a narrated presentation of my Wicked Problem of Practice

  • If a child walked up and asked, “What is an angle?” how would I respond?

    Two rays that share an endpoint.
    A measure of rotation.
    A fraction of a full turn.

    I know those answers. But do I understand what it means to teach that idea to someone?

    Geometry has always felt like the “last” unit. When curriculum pacing slips, geometry quietly absorbs the loss. I find myself wondering: what message does that send? If number and operations get months of attention and geometry gets weeks (if we are lucky), are we unintentionally signaling that spatial reasoning is secondary?

    And yet, when I look at my classroom, geometry is anything but secondary.

    In past years, my students hunted for a “lost angle” in a bucket of Orbeez after solving for missing measures. Each task card showed a set of related angles with one missing value, and once students calculated that missing measure, they searched the Orbeez bin for the matching angle piece to complete their card.

    Figure 1. Students searching for the “lost angle.” (Shared with permission.)

    They went “fishing” for acute, obtuse, and right angles to rebuild full circles in a game we called Caught Acute Fish. The room was loud. They were moving. They were arguing about 90 degrees.

    Video 1. Students playing “Caught Acute Fish.” (Shared with permission.)

    It was magnetic.

    At the time, I celebrated the engagement. Now, after reading about process standards and participation mathematics (Martínez Hinestroza, 2019), I am asking harder questions.

    • Were students merely participating in activity, or participating in reasoning?
    • Did the play invite sense making, or did it simply disguise procedures?
    • Was I creating space for multiple strategies, or funneling them toward one “correct” approach?

    This reflection has sharpened my Knowledge of Content and Students (KCS; Hill & Ball, 2009). I know many of my students are hesitant to speak unless they are certain they are correct. I was that student. Participation, to me, once meant public correctness. Now I interpret participation differently. A student quietly trying a peer’s strategy is participating. A student gesturing agreement is participating. A student revising their thinking mid-game is participating.

    Geometry, especially, demands that we broaden our definition of participation. Spatial reasoning is not equally distributed. Some students instantly visualize rotations and symmetry. Other students need physical movement, drawing, and talk. That is not ability, it is experience. The kinds of spatial play historically encouraged for boys often differ from those encouraged for girls. If construction toys and spatial tasks are culturally coded as “for boys,” and relational or doll-based play is undervalued mathematically, then we are not just teaching geometry. We are navigating identity.

    That realization has unsettled me in a productive way.

    What if expanding participation structures in geometry is also a way to expand who feels like they belong in mathematics?

    When I play “Geometry Simon Says” with various lines and angles, I am not just rehearsing vocabulary. I am building embodied understanding.

    Video 2. “Geometry Simon Says” in action. Students building embodied understanding of lines and angles through movement and play (shared with permission).

    When I label strategies in Number Talks and refer back to them later, I am not just reviewing content. I am preserving student thinking in the room.

    Kilpatrick et al. (2001) remind us that mathematical proficiency includes conceptual understanding, strategic competence, adaptive reasoning, and productive disposition. Geometry offers valuable context for all four. But only if we resist the urge to treat it as a checklist at the end of the year.

    So now I wonder:

    • What would it look like if geometry were treated as foundational rather than supplemental?
    • What would shift if participation were measured by reasoning rather than volume?
    • How might playful, rigorous geometry experiences disrupt quiet narratives about who is “naturally good” at math?

    Perhaps the right angle is not just 90 degrees.
    Perhaps it is the perspective from which we choose to teach.

    References

    Hill, H. C., & Ball, D. L. (2009). The curious—and crucial—case of mathematical knowledge for teaching. In F. K. Lester Jr. (Ed.), Second handbook of research on mathematics teaching and learning (pp. 111–155). Information Age Publishing.
    Kilpatrick, J., Swafford, J., & Findell, B. (Eds.). (2001). Adding it up: Helping children learn mathematics. National Academies Press.
    Martínez Hinestroza, J. M. (2019). Connecting reflection and practice: Transforming a mathematics classroom culture of participation (Doctoral dissertation, Michigan State University). ProQuest Dissertations & Theses Global. https://www.proquest.com/docview/2281272410

  • Today I created a forced perspective hallway as part of a quickfire activity, and it ended up being much more engaging than I expected. I initially reached the “no color” stage and could have easily stopped there, but I was enjoying the process and decided to keep going. Once I added color and detail, the illusion of depth really came to life, especially when viewed through the camera.

    This activity connects naturally to third-grade geometry standards, particularly 3.G.A.1 and 3.G.A.2. Students must reason about lines, angles, and how shapes fit together on a flat surface while creating the illusion of three-dimensional space. It also strengthens visual reasoning, as students explore how parallel lines can appear to meet and how spacing changes to suggest distance.

    What I appreciate most about this task is that it blends creativity with rigorous geometric thinking. It invites students to apply spatial reasoning in a meaningful way while remaining grounded in grade-level standards.

  • When I started designing my survey for my Wicked Problem Project (WPP), I thought I had my question nailed down. I quickly realized I didn’t. Back to the drawing board.

    After refining, I landed on this:
    Why is elementary curriculum typically structured in isolated, subject-specific programs instead of integrated frameworks that support cross-curricular learning?

    Wicked, I know.

    This question feels especially important right now. With teacher burnout and staff turnover high, asking educators to juggle multiple disconnected curriculum programs with minimal planning time feels unsustainable. What would it look like if, instead of five separate books, we had one cohesive framework?

    Figure 1: Curriculum conversations framework. Note. From “Curriculum Conversations: Do’s and Don’ts,” by J. Davis Bowman, 2015, Edutopia (https://www.edutopia.org/blog/curriculum-conversations-dos-and-donts-jennifer-davis-bowman). Copyright 2015 by Edutopia.

    Clarifying my problem helped me clarify my audience. While many stakeholders influence curriculum design, elementary teachers made the most sense as they live this structure every day.

    Designing the survey was more layered than I expected. I included a filter question to ensure respondents teach multiple core subjects so my data aligns with my question. I also placed demographic questions at the end to avoid unintentionally priming responses, aligning with survey design research on question order and bias (Gehlbach, 2015). I balanced forced-choice and open-ended questions to gather both patterns and lived experiences.

    Even small design choices were intentional. I chose a calming green background and a books-themed header to reflect the multiple programs that sparked this inquiry.

    Ultimately, this process pushed me to think about alignment. My survey now reflects clarity, not just frustration. I’m curious to see what patterns emerge about the systems shaping elementary curriculum.

    If you are an elementary teacher responsible for multiple core subjects, you’re welcome to take my survey here: Understanding Integrated Instruction.

    References

    Davis Bowman, J. (2015). Curriculum conversations: Do’s and don’ts. Edutopia. https://www.edutopia.org/blog/curriculum-conversations-dos-and-donts-jennifer-davis-bowman

    Gehlbach, H. (2015). Seven survey sins. Journal of Early Adolescence, 35(5/6), 883–897.

  • For this week’s assignment, I created a sketchnote video to document and reflect on my Quickfire questioning process. While I have lightly edited videos before, this was my first time producing a short, highly structured video that required visual organization and concise narration. I used iMovie to edit my recording, which allowed me to trim clips, adjust timing, and layer audio and visuals together. One of the biggest challenges was balancing clarity with time. Because I chose to read each question within each category, the video could easily become much longer than desired. I had to be intentional about pacing so that my ideas were not rushed, while still keeping the final product at a reasonable length.

    To record, I used my iPhone and a gooseneck tripod to get the correct angle for my lightboard drawings, which added an extra technical step. I then uploaded my finished video to YouTube in order to generate captions, which was a new process for me. However, the captions did not auto-generate as expected, so I ended up typing them manually. In hindsight, I could have completed this step directly in iMovie. While this process took more time than planned, it helped me better understand the importance of accessibility and captioning in digital content.

    I also enjoyed experimenting with the lightboard format, which made the process more engaging and helped visually represent my thinking. Creating this video pushed me to think carefully about how to communicate complex ideas efficiently. Moving forward, I could see myself using sketchnote videos with students or colleagues as a way to model reflection, organize thinking, and share learning in a creative and accessible format!

    References

    Berger, W. (2014). A more beautiful question: The power of inquiry to spark breakthrough ideas. Bloomsbury.

  • When my students and I work on spiral review of concepts from previous years, they often question why we go back to “easy” math so frequently. This usually leads to a conversation about building a house. “If I wanted to build a house, where would I start?” I ask. “Would I build it on cotton candy? Toothpicks? Q-Tips?” The idea is hilarious to eight-year-olds, and their immediate response is always, “No, of course not!”

    Figure 1: Just like this house needs a strong foundation before anything else can work, students need solid number sense before moving forward in math.

    That moment opens the door to an important lesson: our ability to be successful mathematicians relies on a solid foundation. We must build and maintain strong mathematical understanding before moving forward. While their excitement fades when they realize there is no actual cotton candy involved, the message stands. Without a strong foundation, our learning is unstable.

    Number and Operations are that foundation. Building strong number sense, and learning to question, fail, and grow from mistakes, is essential in early mathematics. When designing an intervention program for struggling third graders, I am reminded of the importance of returning to these foundational ideas.

    Video 1: Sometimes doing the same thing over and over doesn’t mean you understand it

    Research shows that students can appear successful while relying heavily on rules and procedures without true understanding (Erlwanger, 1972; Skemp, 1978). Reflecting on Benny’s experience and Skemp’s distinction between instrumental and relational understanding has pushed me to reconsider how often students may arrive at correct answers without truly knowing why.

    Within my third-grade class, I have a small group of students—my intervention group—whose knowledge ranges from deep misconceptions to unfamiliarity with basic concepts. When I work with them, our shared goal is to address misunderstandings, strengthen number sense, and move beyond counting by ones. While this may seem simple in third grade, it can be overwhelming for some students.

    Mathematical proficiency includes conceptual understanding, strategic competence, adaptive reasoning, productive disposition, and procedural skill working together (Kilpatrick et al., 2001). Many of the students in my intervention group show gaps in conceptual understanding, which limits their ability to reason flexibly and persevere when challenged. This reinforces the importance of returning to foundational number and operations concepts as part of our work together.

    I often wonder how many of these students were previously rewarded for speed and accuracy rather than depth of understanding. What if their struggles stem not from lack of ability, but from years of learning mathematics as rule-following rather than sense-making? Perhaps this work is not only about rebuilding skills, but also about rebuilding students’ confidence as mathematical thinkers.

    This work has also deepened my Mathematical Knowledge for Teaching, particularly my Knowledge of Content and Students (KCS). Through working with this intervention group, I have become more aware of how easily students rely on counting strategies and rule-following when they lack strong place value understanding. I now anticipate common misconceptions, such as assuming that every addition problem requires counting by ones, or believing that speed matters more than reasoning. This awareness helps me design instruction that directly addresses these tendencies and supports students in developing more flexible and meaningful strategies.

    Exploring different pedagogical strategies has strengthened my instructional decision-making. Practices such as thinking aloud with justification and number talks align with the NCTM Process Standards for communication, reasoning, and representation (NCTM, 2000), as well as the Standards for Mathematical Practice, particularly making sense of problems and persevering (CCSSO, 2010).

    Ultimately, this work has reinforced my belief that strong number and operations instruction is not about remediation, but about restoration. Restoring confidence, curiosity, and conceptual understanding is central to my teaching. As I continue to develop my mathematical knowledge for teaching, I am increasingly aware that my instructional choices shape not only what students learn, but how they see themselves as learners.

    References

    Common Core State Standards Initiative. (2010). Common Core State Standards for Mathematics. National Governors Association Center for Best Practices and Council of Chief State School Officers.
    https://www.corestandards.org/Math/

    Erlwanger, S. H. (1972). Benny’s conception of rules and answers in IPI mathematics. Journal of Children’s Mathematical Behavior, 1(1), 7–26.

    Kilpatrick, J., Swafford, J., & Findell, B. (2001). Adding it up: Helping children learn mathematics. National Academies Press. https://doi.org/10.17226/5109

    National Council of Teachers of Mathematics. (2000). Principles and standards for school mathematics. NCTM.

    Skemp, R. R. (1978). Relational understanding and instrumental understanding. Mathematics Teaching, 77, 20–26.